Key Takeaways:
- Mathematical Lag is Inevitable: Standard indicators rely on historical "look-back periods" that are too slow for the 1-minute chart's rapid pace.
- Visual Velocity > Indicators: Success in scalping comes from reading the speed and aggressiveness of candle formation (the "tape") rather than waiting for lagging crossovers.
- Market Structure is the Foundation: Professional entries are found by identifying shifts in swing highs/lows and "Trap Zones" where retail traders get caught.
- Risk is Structural: Stops should be placed based on price invalidation points rather than arbitrary indicator levels to protect capital in high-volatility environments.
The Mathematical Trap: Why Your 1-Minute Indicators Are Always Late

For many day traders, the search for the best indicator for 1 minute chart ends in a cycle of frustration. You see a crossover, enter the trade, and immediately realize the move has already happened. This isn't bad luck; it is a mathematical certainty. In a millisecond-driven environment, most technical indicators are not predictive—they are historical summaries.
The Fatal Flaw of Look-Back Periods
Every standard indicator, from the Simple Moving Average (SMA) to the Relative Strength Index (RSI), relies on a "look-back period." On a 1-minute chart, a 14-period RSI tells you what happened over the last 14 minutes. In the world of high-frequency trading and rapid market structure shifts, 14 minutes is an eternity. By the time the math "catches up," the momentum exhaustion has often already begun. You are essentially driving a car at high speeds while looking only in the rearview mirror.
The "Volume Trap" and Artificial Confidence
The lag is exacerbated by the "Volume Trap." When a "whale" or institution enters a massive position, the resulting spike creates a feedback loop. Indicators react to this surge, flashing "buy" signals to retail traders. However, by the time these signals reach your screen, the whales have established their positions and the market is primed for a "Failed Breakdown" or a bull trap.
💡 Trader's Reality: Real speed isn't about configuring a faster MACD; it's about reaction time. If you are waiting for a line to cross, you are already late. Learn the philosophy of raw speed in The Need for Speed: Why High-Velocity Trading is Impossible on Ethereum.
📉 The Lag Gap Visualized
| Event | Price Action Trader (Real-Time) | Indicator Trader (Lagging) |
|---|---|---|
| Market Reversal | Sees "Wick Rejection" instantly | Waits for "Close" to calculate |
| Entry Signal | Enters on the break of the candle | Enters 2-3 candles later (Cross) |
| Result | Captures the meat of the move | Enters at the exhaustion point |
Leading vs. Lagging: The Illusion of Certainty in Scalping
The pursuit of "confirmation" is the primary reason scalpers fail. In 1-minute trading, waiting for a lagging MACD signal is often synonymous with entering exactly when smart money is exiting. Because these indicators require closed candles to calculate values, the signal is inherently delayed.
The Cost of Confirmation
On a low timeframe, this delay results in:
- Poor Risk-to-Reward Ratios: Entering late requires wider stop-losses.
- Whipsaws: Lagging tools often provide buy signals at the top of a range and sell signals at the bottom.
- Psychological Friction: Watching a move happen and then seeing it reverse immediately after your "confirmed" entry leads to revenge trading.
To escape this, professional traders pivot toward price action analysis and real-time data. Unlike the delayed feedback of an oscillator, observing candlestick speed provides an immediate look at the battle between buyers and sellers.
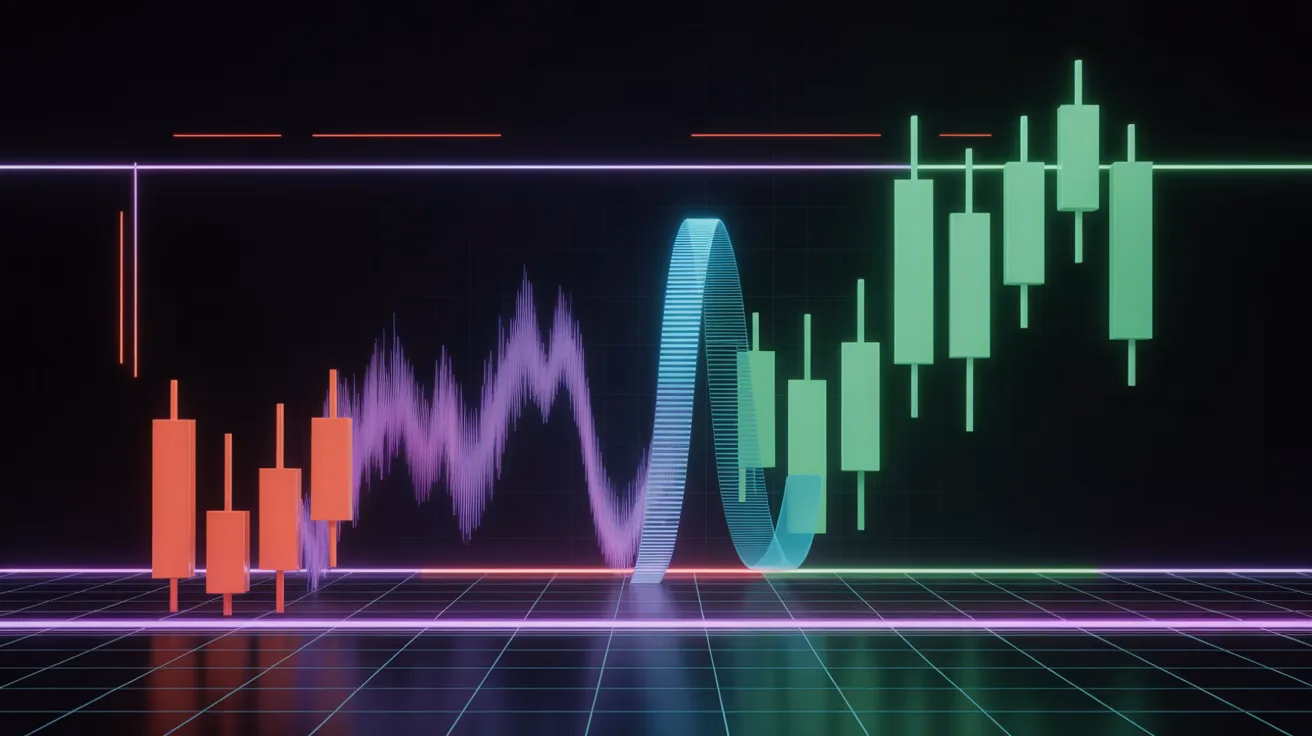
Defining Visual Velocity: Reading the Tape Without the Tape
Visual velocity is the measurement of the speed, size, and aggressiveness of candle prints as they form. While traditional indicators calculate the "where," visual velocity focuses on the "how." It is the difference between a market that is drifting and one that is "returning with purpose."
The Mechanics of "Tape Reading" on the Chart
Reading the tape without a Level 2 montage requires focusing on "loud" signals where institutional flow is active:
- Displacement Speed: How fast is price moving from Point A to Point B? High-velocity candles fill quickly with minimal wicking.
- Order Flow Aggression: Large "marubozu" candles closing near their extremes indicate one side is overwhelmed.
- The "Resting" Phase: High velocity is often followed by a period of "digestion." If the pullback is slow compared to the thrust, the trend is likely to continue.
By focusing on the "posture" of the market, you gain a predictive edge. When the tape speaks through rapid, large-bodied candles, the trend tailwind is at its strongest.
🚀 Speed Check: You can't read velocity if you are distracted by complex interfaces. Simplify your setup to focus on the "Tape." See why less is more in The Setup: Why You Don’t Need 6 Monitors to Trade High-Velocity.
The 3 Pillars of Velocity Trading: Displacement, Rejection, and Follow-through
To master the 1-minute chart, you must analyze how price moves in real-time. By focusing on these three pillars, you can enter trades while retail momentum indicators are still calculating.
Pillar 1: Displacement
Displacement is the primary signal of order flow imbalance. It occurs when price moves aggressively with large bodies and minimal wicks. High-velocity displacement typically features candles where the body represents at least 70% of the total range.
Pillar 2: Rejection
If displacement is the gas, rejection is the brake. On a 1-minute chart, rejection happens in seconds. A high-probability rejection is defined by "Wick Strength"—when the wick is at least twice the size of the body. This is a visual representation of a "trap" where breakout traders are caught.
Pillar 3: Follow-through
Follow-through separates a temporary "blip" from a tradable move. Look for consistency: the 3-bar volume average should stay steady or increase. If the price retraces more than 50% of the displacement candle, the velocity has dropped, indicating a low-probability environment.
Pure Price Action: Replacing Lagging Signals with Market Structure

Instead of over-smoothing data with moving averages, focus on market structure—the underlying framework of the two-way auction.
Identifying "Trap Zones"
On the 1-minute chart, "Trap Zones" occur when price sweeps above a previous high but fails to close there. This is an institutional footprint where liquidity is harvested. By identifying a break of structure—such as price breaking below a recent higher low—you get a faster entry signal than any mathematical derivative.
🛡️ The "Visual Velocity" Execution Framework
| Step | Action | Focus Point |
|---|---|---|
| 1. Scan | Identify Macro Trend | Is the higher timeframe Bullish or Bearish? |
| 2. Locate | Mark Key Levels | Where are the Swing Highs/Lows? |
| 3. Observe | Watch Velocity | Does price explode or stall at these levels? |
| 4. Execute | One-Tap Entry | Enter on Displacement (Speed), not confirmation (Lag). |
Risk Management for High-Velocity Scalping
Trading on a 1-minute timeframe is a race against volatility. In high-velocity scalping, the speed of the market can erode an account faster than a trader can manually react.
The Fallacy of Indicator-Based Stops
Traditional advice suggests placing stops based on a lagging indicator. On a 1-minute chart, this is fatal. Professional scalping requires stops based on price invalidation. If your thesis is based on a specific velocity move, your stop must be placed where that logic is proven wrong.
Essential Protocols
- Hard Stop-Loss Orders: Never use "mental stops." A single moment of hesitation can wipe out a day's gains.
- Volatility-Adjusted Sizing: Use the Average True Range (ATR) to ensure risk remains constant as volatility fluctuates.
- Daily Loss Caps: Set a "circuit breaker." Once a daily loss limit is reached, stop trading to prevent emotional revenge trading.
- Manage Slippage: High leverage amplifies slippage risk. During high-velocity moves, the spread can widen in milliseconds, triggering stops prematurely.
🛡️ Pro Tip: False breakouts are the most common way velocity traders get trapped. Learn to spot the difference between a "Breakout" and a "Fakeout" in The "Wick" Betrayal: How to Spot False Breakouts.
Conclusion: Transitioning from 'Signal Hunting' to 'Price Reading'
Mastering the 1-minute chart is about shifting from a passive observer of lagging signals to an active reader of live dynamics. The "holy grail" isn't a line on a screen—it is your ability to interpret market structure in real-time.
Stop looking for the perfect signal and start looking for the story the price is telling. When you see the market as a flow of orders rather than lagging lines, you gain the "visual velocity" needed to anticipate moves. Trust your eyes, respect the structure, and remember: in scalping, speed and context are your most valuable assets.
FAQ
Q: Why do my 1-minute indicators always seem to signal after the move is over? A: This is due to "look-back lag." Indicators like RSI or Moving Averages average past data. On a 1-minute chart, even a short look-back period represents "old" information compared to the millisecond-level shifts in institutional order flow.
Q: Is price action really better than indicators for scalping? A: Price action is "zero-lag" because it represents the actual trade data as it happens. Indicators are derivatives of price; by focusing on candle speed and market structure, you are viewing the source material rather than a delayed calculation.
Q: How do I identify a "Trap Zone" without indicators? A: Look for "liquidity sweeps." This happens when price moves past a clear swing high or low but immediately snaps back with high visual velocity. This "rejection" shows that there was no real follow-through, only a hunt for stop-losses.
Q: What is the most important risk rule for 1-minute traders? A: Using automated "hard" stops. Because the 1-minute chart moves so quickly, human reaction time is often too slow to prevent a catastrophic loss during a sudden volatility spike. Always have your exit programmed the moment you enter.
Explore More Trading Resources
Solved your immediate problem? Go deeper:
- Trading Psychology Guide - Why discipline fails and how architecture solves it
- Momentum Trading Guide - Pattern recognition and execution frameworks
- Speed Advantage Guide - Infrastructure that multiplies edge
Browse all resources: Trading Tools & Resources Hub
Ready to trade with zero friction? → Start on Manic.Trade