Key Takeaways
- Zero Latency: Unlike lagging indicators (RSI, MACD), price action provides real-time data, allowing traders to enter moves before the "herd" arrives.
- Institutional Alignment: Professional "Smart Money" participants trade based on liquidity zones and order flow rather than mathematical derivatives.
- Structural Mastery: Success on the 5-minute chart depends on identifying Market Structure (HH, LL) and the Change of Character (CHoCH) to anticipate reversals.
- Risk Precision: Using price-based invalidation points rather than fixed-pip stops protects capital against volatility and institutional "stop hunts."
The Trap of Lagging Indicators on the 5-Minute Timeframe

If you have ever entered a trade because an oscillator crossed into "oversold" territory, only to watch the price continue to plummet, you have experienced the inherent frustration of lagging indicators. For intraday traders in the United States seeking the best indicator for 5 minute chart success, the reliance on traditional tools like RSI, MACD, or Moving Averages often leads to a cycle of late entries and missed reversals.
The fundamental issue is that these indicators are derivatives of price. They use historical data—the "ghosts" of past candles—to calculate a value. In the high-velocity environment of a 5-minute chart, by the time a lagging signal confirms a trend, the "Smart Money" has already positioned itself, and the meat of the move is often over. Many traders find that indicators fail more often than expected because they cannot adapt to the rapid shifts in intra-day sentiment.
Why Traditional Indicators Fail in Fast-Paced Markets
On a 5-minute timeframe, every second counts. However, most popular technical tools are mathematically anchored to the past, creating several critical pitfalls for scalpers:
| Indicator Type | Lag Time (Candles) | What It Measures | Why It Fails on 5m |
|---|---|---|---|
| RSI (14 period) | 3-5 candles | Past 14 candles overbought/oversold | Confirms reversal after move exhausted |
| MACD (12,26,9) | 4-6 candles | Momentum crossovers from history | Signal appears when trend already mature |
| Moving Averages (20 SMA) | 2-4 candles | Average of past 20 closes | Price moves 10+ pips before MA reacts |
| Bollinger Bands | 2-3 candles | Volatility from 20-period SD | Price "walks the bands" in strong trends |
- The Delay Factor: Indicators like the Simple Moving Average (SMA) or the MACD rely on historical price inputs. These tools confirm trends rather than predict them. On a 5-minute chart, a "confirmation" signal might arrive three or four candles late, forcing you to buy at the top of a move or sell at the bottom.
- False Signals in Sideways Markets: During low-volatility periods or "choppy" price action, lagging indicators often produce "whipsaws." For example, Bollinger Bands may narrow, but touching a band does not guarantee a reversal; in a strong trend, the price can "walk the bands" while your oscillator screams that the market is overextended.
- Short-Term Noise: Low liquidity or sudden institutional orders can create "noise" that distorts indicator readings. A small volume spike might cause a temporary crossover in the Accumulation/Distribution (A/D) line, leading retail traders into a trap while the underlying market structure remains unchanged.
- Self-Fulfilling Prophecies and Traps: Because tools like the EMA are so widely used, they often lead to crowded trades. When a large number of retail traders act on a "Golden Cross" simultaneously, it can create a temporary price surge that institutional players use as liquidity zones to fill their own sell orders.
The Illusion of Mathematical Certainty
Many traders gravitate toward indicators because they provide a sense of objective certainty in an uncertain market. It feels safer to click "buy" when a line turns green. However, this is often a psychological crutch. This is the same trap that complexity creates for traders—stacking indicators doesn't increase edge, it obscures what actually matters. While a Triple Exponential Moving Average (TEMA) or a Weighted Moving Average (WMA) attempts to reduce lag by placing more weight on recent data, they still cannot account for real-time shifts in smart money concepts.
For a scalping strategy to be effective, you need to be ahead of the curve, not chasing it. Relying on lagging indicators on the 5-minute chart is like trying to drive a car by only looking at the rearview mirror. To truly master the 5-minute timeframe, traders must move away from these mathematical shadows and learn to read the raw language of the market: price action.
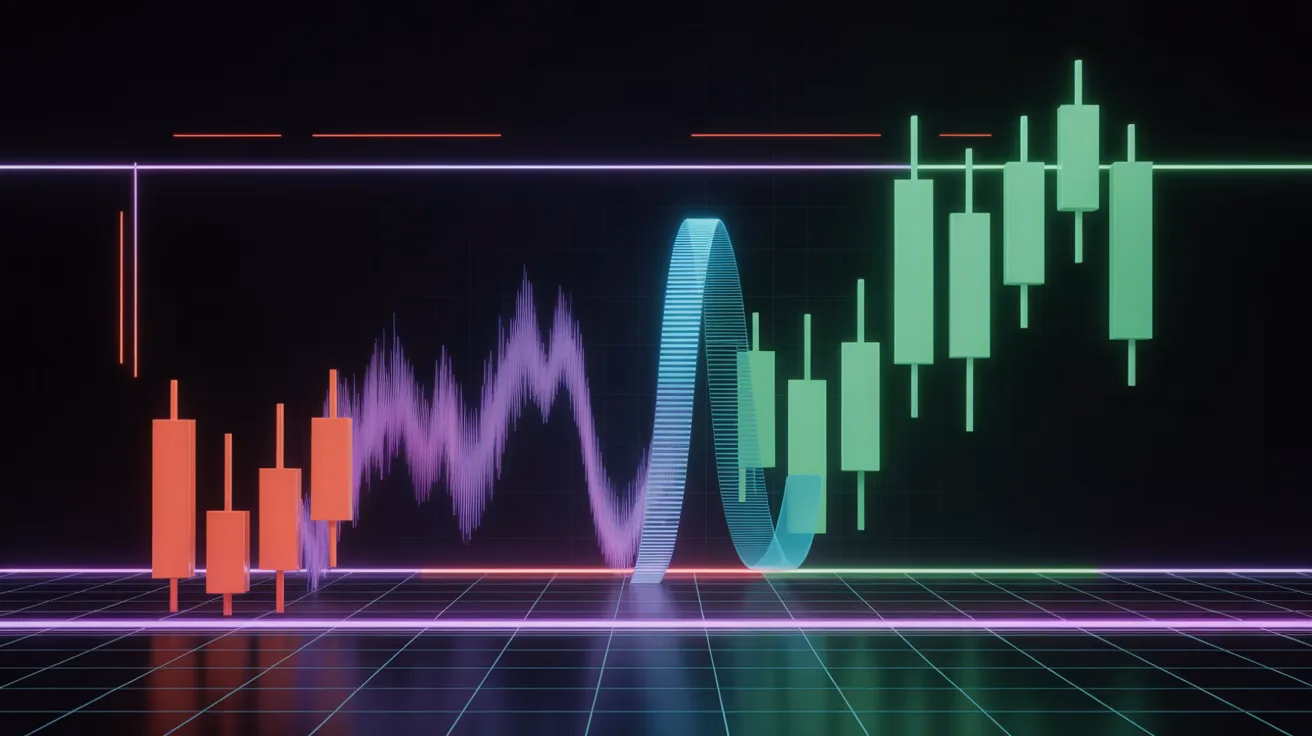
💡 Pro Tip: Indicators Confirm What Price Already ShowedWhen your RSI finally crosses 30 to signal "oversold," price already fell 15 pips three candles ago—when smart money was buying. By the time MACD confirms the bullish crossover, institutions are exiting into your late entry. The 5-minute chart moves too fast for mathematical derivatives. You need real-time data, not historical echoes. Before adding another oscillator, learn how to spot visual velocity patterns that institutions actually trade—price compression, not indicator divergence.
Price Action: The Only Real-Time Data Source

In the fast-paced environment of intraday trading, price action stands as the only truly "leading" indicator. It is the raw data of the market, representing the immediate decisions of buyers and sellers in real-time. While traditional indicators provide a filtered view of the past, price action offers a transparent window into current market structure.
The Fallacy of Lagging Indicators
To master the 5-minute timeframe, you must recognize that indicators are essentially "echoes." Because they rely on historical data—such as the closing prices of the last 14 candles—they are inherently backward-looking. In a scalping environment where a few seconds can be the difference between a profitable trade and a stop-out, price action traders prioritize the "story" told by the candles themselves.
By focusing on the direct movement of price, traders can:
- Reduce Indicator Clutter: Clear charts allow for better focus on candlestick patterns and volume.
- Identify Institutional Flow: Spot where "Smart Money" is entering the market through liquidity zones.
- React Faster: Execute trades at the moment a change of character (ChoCh) occurs.
- Improve Accuracy: Avoid the "false signals" often generated by indicators during low-volatility periods.
Why Price is the Most Honest Information
In the financial markets, price is the ultimate truth. It is the point at which supply and demand meet. Professional scalping strategy development relies on reading this "honest" data. By observing how price reacts at specific levels—whether it aggressively breaks through or gets rejected—you gain insight into the strength of the current trend. It is important to remember that price action isn't just patterns; it's a narrative.
By treating price as your primary data source, you shift your mindset from a reactive observer to a proactive analyst. You stop chasing the market and start anticipating it based on the smart money concepts of supply, demand, and structural shifts. In the 5-minute arena, price action isn't just an alternative—it is the only data source that keeps pace with the heartbeat of the market. This aligns perfectly with minimalist trading principles—less indicator noise, more price clarity.
Why Institutions Ignore Indicators and Follow Price Levels
If you have ever wondered why a "textbook" MACD crossover failed on your 5-minute chart, the answer lies in who is on the other side of your trade. Institutional participants—the banks, hedge funds, and asset managers who drive the market—operate on an entirely different logic. For these "Smart Money" players, trading is about managing massive position sizes and finding sufficient liquidity to execute them without moving the market against themselves.
The Liquidity Game: Why Order Flow Trumps Indicators
Institutional traders do not have the luxury of clicking a button and getting an instant fill for 5,000 contracts. To enter or exit a position, they require a counterparty. This necessity creates a specific market structure that revolves around liquidity zones—areas where a high volume of stop-loss orders reside.
Instead of looking at a 5-minute stochastic oscillator, institutions focus on:
- Liquidity Pools: Banks target areas where retail stops are clustered (often above previous highs or below previous lows) to "fuel" their own large entries.
- Order Flow Dynamics: They track the actual volume of buy and sell orders hitting the tape.
- Price Levels over Signals: A trade does not exist for a professional until a specific, predetermined price level is reached.
| Retail Trader Focus | Institutional Trader Focus | Why Retail Loses |
|---|---|---|
| RSI overbought signal | Liquidity sweep above recent high | RSI signals reversal; institutions trigger stops then reverse |
| MACD bullish crossover | Order block at previous consolidation | MACD confirms late; institutions already positioned |
| Moving average bounce | Fair value gap from imbalance | MA is arbitrary; institutions trade supply/demand zones |
| Bollinger Band touch | Stop-loss clusters below structure | Bands measure volatility; institutions hunt stop liquidity |
Market Efficiency and the "Smart Money" Perspective
The reality of the best indicator for 5 minute chart success is realizing that price is a leading indicator, while everything else is lagging. Institutional investors in public markets value their portfolios based on prevailing market prices and actual price discovery, not technical overlays. When a change of character occurs, it is usually the result of institutional absorption—where a large player is "soaking up" the selling pressure at a key level.
How to Align with Institutional Flow
To stop trading like a "weak hand" and start thinking like a liquidity provider, you must shift your focus toward smart money concepts.
- Identifying Value Areas: Stop looking for "overbought" signals and start looking for where the market has spent the most time and volume.
- Waiting for Confirmation: Professionals do not predict; they react. They wait for a clear level and a reaction at that level before committing capital.
- Recognizing Institutional Footprints: Watch for "sweeps" of liquidity—where price briefly breaks a level to trigger stops before reversing sharply.
By stripping away the noise of lagging indicators and focusing on how institutions move capital, you align yourself with the actual forces that move the 5-minute chart. Consistency comes from making fewer, higher-probability decisions.
Mastering Market Structure: The Core of 5-Minute Price Action
To find the best indicator for 5 minute chart trading, you must look past the lagging oscillators and focus on the skeleton of the market: its structure. On a fast-paced 5-minute timeframe, understanding whether the market is trending or consolidating is vital.
The Building Blocks: HH, HL, LH, and LL
Market structure is the most objective way to define a trend. Price action traders identify trends through the relationship between swing points:
- Uptrend: Characterized by a series of Higher Highs (HH) and Higher Lows (HL).
- Downtrend: Defined by Lower Lows (LL) and Lower Highs (LH).
By identifying these structural points on the 5-minute chart, you can anticipate "explosive momentum moves" rather than reacting to them late. This is a core component of any SMC trading strategy, which seeks to find the underlying intent of the market. This structural awareness is the foundation of the art of momentum trading—catching moves at their structural birth, not their indicator-confirmed death.
Change of Character (CHoCH): The Early Warning Signal
In a scalping strategy, timing is everything. The most critical structural shift for a 5-minute trader is the Change of Character (CHoCH). A CHoCH occurs when the price breaks the most recent structural swing point (e.g., price drops below the previous Higher Low in an uptrend).
Unlike lagging indicators that require multiple candles to "confirm" a turn, a CHoCH provides a real-time alert that the market structure has shifted. This allows you to stop looking for buys and start identifying liquidity zones for potential short entries before the rest of the market catches on.
Why Structure Trumps Indicators on Low Timeframes
| Approach | Signal Type | Lag Time | Reliability on 5m |
|---|---|---|---|
| RSI Divergence | Lagging (historical 14 candles) | 3-5 candles | Low (false signals in trends) |
| Market Structure (CHoCH) | Leading (real-time break) | 0 candles (immediate) | High (objective price reality) |
| MACD Crossover | Lagging (12/26 period average) | 4-6 candles | Low (confirms exhausted moves) |
| Break of Structure (BOS) | Leading (continuation signal) | 0 candles (immediate) | High (aligns with trend flow) |
The 5-minute chart is notoriously volatile. Using tools without judgment creates noise, whereas "judgment anchored in structure creates opportunity." To master this, you must adopt a Smart Money Concepts mindset:
- Clarity Over Complexity: By focusing on candlestick patterns and swing points, you remove the lag.
- Multi-Timeframe Alignment: A 5-minute setup is more powerful when it aligns with the higher timeframe structure.
- Risk Management: Structure provides clear "invalidation points."
⚡ Reality Check: Structure Beats Oscillators Every TimeYour RSI shows "oversold 25" but price keeps falling. Why? Because market structure is still bearish (lower lows, lower highs). RSI measures 14 candles of history; structure measures current supply/demand reality. When price breaks the most recent higher low, that's a Change of Character—a real-time structural shift that no oscillator can match for speed. Institutions don't wait for RSI to hit 30; they act when structure breaks. Stop asking "is RSI oversold?" and start asking "did we break the structural low?" The second question predicts; the first confirms too late.
Identifying High-Probability Entry Triggers without the Noise
To master the best indicator for 5 minute chart setups, you must strip away the lagging oscillators and focus on the only thing that moves in real-time. On a fast-paced 5-minute timeframe, professional scalpers look for specific candlestick patterns that signal institutional activity.
The Core Price Action Triggers
On the 5-minute chart, high-probability entries occur when price interacts with key liquidity zones. Here are the primary triggers to watch for:
- Change of Character (CHoCH): The first signal that the current trend is shifting.
- The Pin Bar Rejection: A pin bar with a long wick shows that "Smart Money" has stepped in to absorb orders. On a 5-minute scale, a pin bar that "sweeps" a previous session low is a high-probability long trigger.
- Engulfing Candles: An engulfing pattern serves as a momentum confirmation. When a large bullish candle completely "swallows" the previous bearish candle, it indicates an immediate shift in sentiment.
- Break of Structure (BOS): A BOS occurs when the price continues the existing trend by breaking a fresh swing high or low.
Related Reading
This article is part of our comprehensive guide: Trading Psychology for High-Frequency Scalping: The Complete Mental Discipline Guide.
Discover why 90% of scalpers fail psychologically, the 5 core mental traps destroying traders, and the architectural solutions that eliminate discipline failure without relying on willpower.
This article is part of our comprehensive guide: Momentum Trading Guide: How to Master Crypto Micro-Trends in 30 Seconds as wel.
Discover the 3 types of momentum (news, breakout, continuation), 5 visual patterns with 60%+ win rates, and why Manic.Trade's forced exits capture more profit than "holding for more."