Key Takeaways
- Structural Latency: Synthetic VIX indicators like the Williams Vix Fix are inherently backward-looking because they rely on realized price action rather than forward-looking options premiums.
- The Math of Delay: Mathematical smoothing and volatility buffering create a signal delay that often results in "peak fear" being registered only after the market has already begun to recover.
- Visual Velocity Advantage: Trading "Visual Velocity"—the speed of price displacement—offers a zero-lag alternative that allows traders to react to institutional intent in real-time.
- Actionable Framework: Shifting from lagging oscillators to price action momentum strategies, such as Impulse Rejections and Contraction Breakouts, improves entry precision and risk-reward ratios.
The Illusion of Real-Time: Why Synthetic VIX Indicators Lag
While the Cboe Volatility Index (VIX) is often heralded as the market's "fear gauge," retail traders frequently turn to synthetic versions, such as the Williams Vix Fix, to replicate this sentiment on individual stocks or assets that don't have a native options chain. However, relying on these tools creates a dangerous "illusion of real-time" data. The fundamental issue is that while the spot VIX is a forward-looking measure derived from implied volatility, synthetic indicators are inherently backward-looking.
The Mathematical Trap of Look-Back Periods
The core reason for the synthetic vix indicator lagging lies in its construction. Unlike the actual VIX, which measures market expectations for the next 30 days, synthetic versions are mathematical derivatives of historical price action. Tools like the Williams Vix Fix attempt to simulate volatility by calculating where the current close lies relative to the highest high over a specific period (typically 22 days).
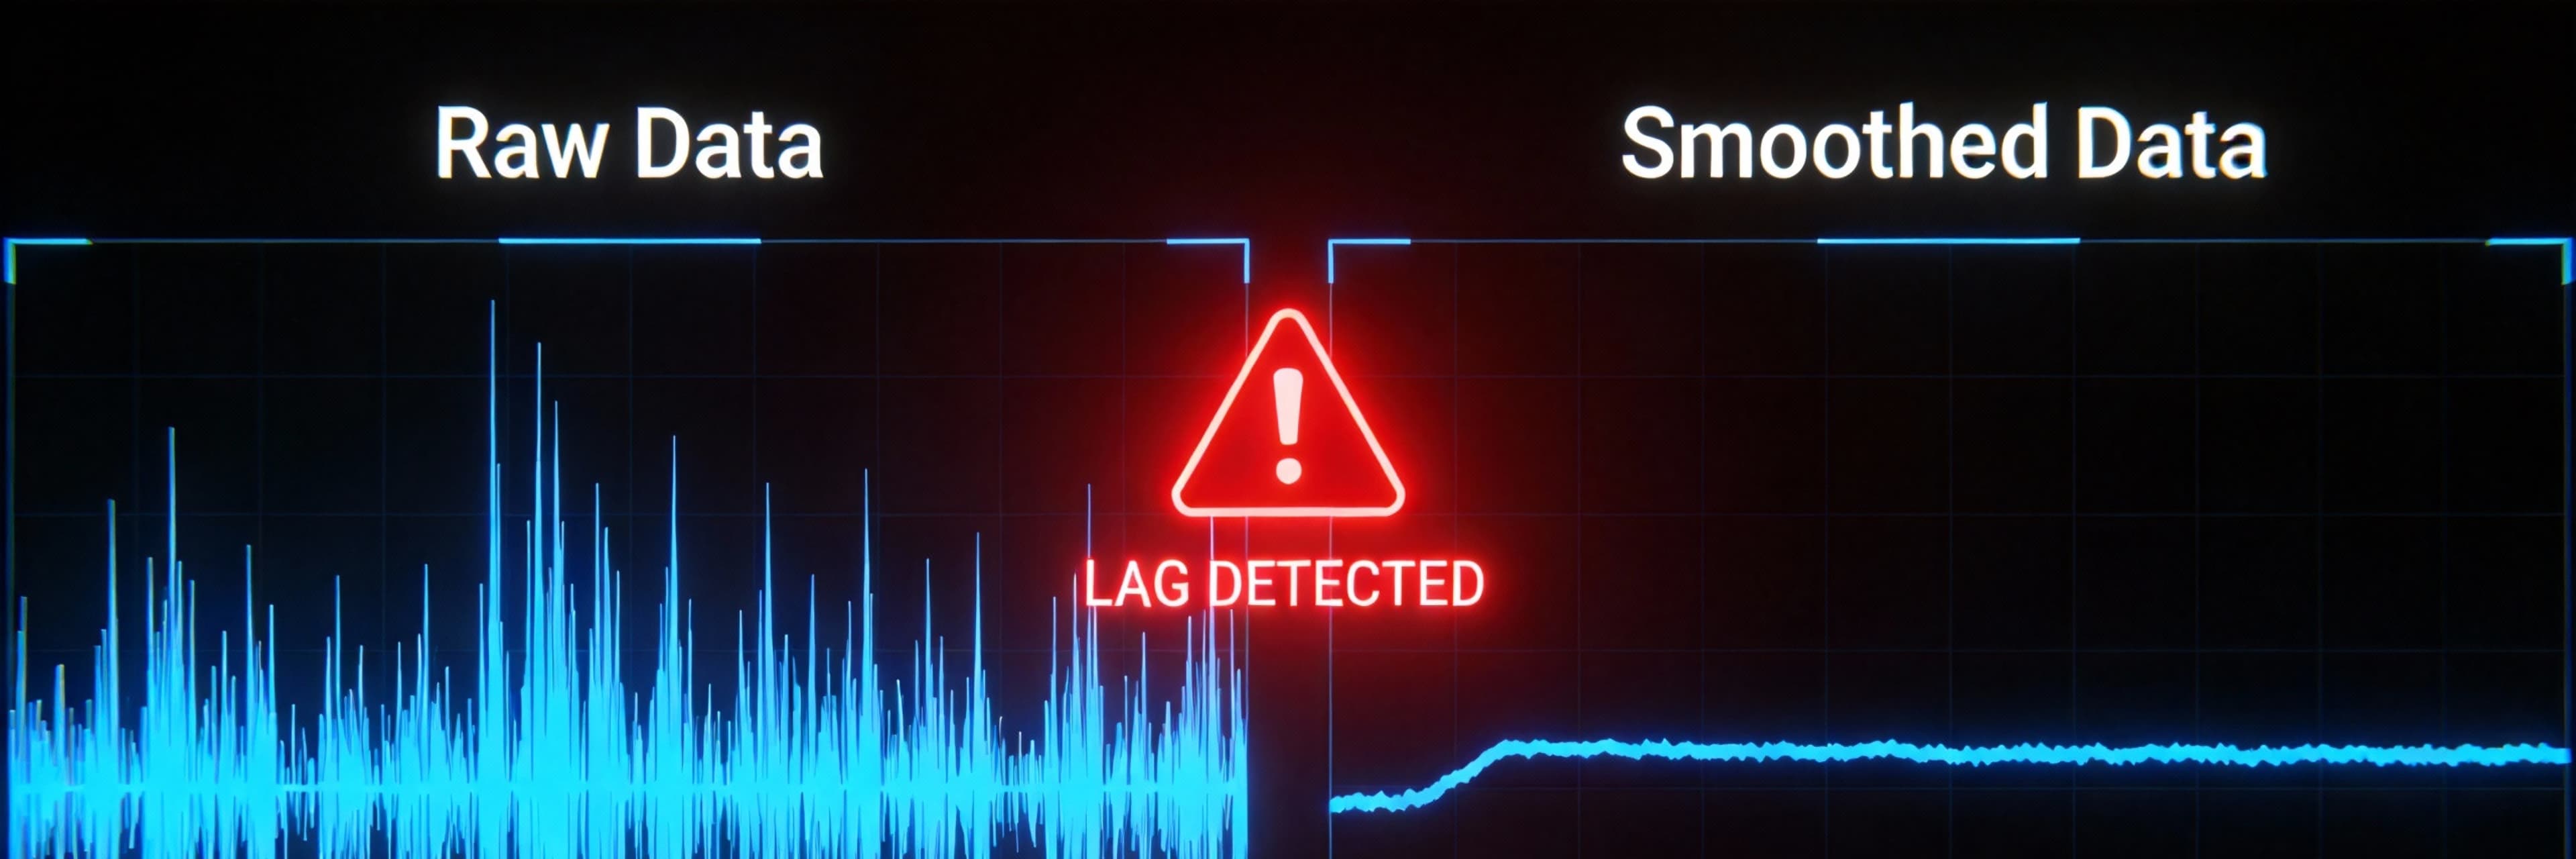
This reliance on historical data introduces several layers of latency. To filter out "noise," many synthetic oscillators apply moving averages or volatility buffering. While this makes the chart look cleaner, it delays the signal. By the time the indicator peaks, the actual price bottom has often already passed. Furthermore, because these indicators measure the distance from a recent high, they require the market to already be in a state of decline before the "volatility" begins to register. You are effectively measuring the result of fear, not the anticipation of it.
💡 Trader's Reality: Waiting for a lagging indicator to "confirm" fear usually means selling the bottom. Learn why relying on past data fails in high-speed markets in Why 1-Minute Indicators Lag and How to Trade Visual Velocity.
Volatility Clustering and the "Slow Recovery" Problem
Another technical reason for the perceived lag is a phenomenon known as volatility clustering. High-volatility periods tend to cluster together, creating a feedback loop where a significant price drop leads to a prolonged period of elevated VIX values. Synthetic indicators often struggle to "reset" during these clusters. Even if the market begins a sharp recovery, the indicator may remain at extreme levels because the mathematical formula is still processing the massive price drop from several bars prior. This creates an apparent “slowness” to drop, which can mislead traders into staying defensive long after the real-time price action momentum has shifted to the upside.
The Math Behind the Lag: Smoothing and Volatility Buffering
To understand why lag is a common frustration, one must look beneath the surface at the mathematical architecture of these tools. Most synthetic volatility indicators attempt to replicate the VIX using only price action data. While useful for identifying major cyclical lows, their reliance on historical look-back periods and statistical smoothing creates a "buffer" that inherently delays real-time response.
Log Differences and Covariance Lags
The foundational math of volatility estimation often relies on the relationship between price changes over discrete intervals. As outlined in studies on multivariate time series, the estimation of signal properties frequently utilizes lag–$\ell$ covariance to define how current price behavior relates to previous states.
When an indicator calculates volatility, it is essentially measuring the dispersion of these log differences over a specific window. The mathematical challenge arises because statistics like Standard Deviation require a set of historical data points to function. By the time a "spike" in volatility is large enough to shift the average of a 20-period window, the actual price move is often already halfway complete.
📉 Visualizing the Delay: Pure vs. Synthetic
| Feature | Pure VIX (Options-Based) | Synthetic VIX (Price-Based) |
|---|---|---|
| Data Source | Implied Volatility (Future) | Historical Price (Past) |
| Reaction Time | Instant (Anticipatory) | Delayed (Requires price drop first) |
| Signal Peak | Often peaks before the bottom | Peaks at or after the bottom |
| Utility | Predictive Warning | Confirmation / trailing signal |
The Smoothing Trap: Moving Averages
Most retail traders use lagging oscillators that apply an additional layer of smoothing—usually a Simple Moving Average (SMA)—to the raw volatility data. In high-velocity environments, this smoothing acts as a low-pass filter. While some advanced techniques attempt to relax filtering during sudden changes to reduce lag, most standard scripts for volatility do not employ such dynamic adjustments. Instead, they treat every tick with equal weight, leading to signal muffling during critical intraday spikes.
Synthetic VIX vs. Pure VIX: Understanding the Structural Gap
The CBOE Volatility Index (VIX) is a forward-looking measure calculated using the prices of S&P 500 index options. Because option prices reflect the premiums investors pay for protection against future price swings, the VIX represents implied volatility. It is a direct "fear gauge" that reacts to market expectations before the actual price movement occurs.
In contrast, synthetic VIX indicators—such as those found in historical volatility libraries—are almost exclusively "derived" from historical price action. The structural gap between these two can be summarized as follows:
- Data Source: Pure VIX uses the options market (expectations); Synthetic VIX uses the underlying price (realized history).
- Calculation Nature: Pure VIX is anticipatory. Synthetic versions are reactive because they require a price drop to occur before the formula can register a spike.
- Market Access: Institutional players access pure volatility through VIX futures. Retail traders often use price-based proxies that are inherently the last to arrive at the party.
Research using Bayesian models shows that volatility is non-linear and subject to structural breaks. Synthetic indicators using linear smoothing fail to capture these breaks, serving more as a confirmation tool than a predictive signal.
🚀 Speed & Execution: While VIX helps macro analysis, micro-execution requires speed. See how top scalpers execute in milliseconds in The 0.5 Second Rule: Why “One-Tap Execution” is the Holy Grail.
What is Pure Visual Velocity? Trading Without Indicators
Professional price action traders often pivot toward a more raw, immediate metric: Visual Velocity. In trading, Visual Velocity represents the speed of price displacement—literally, the distance price travels over a specific unit of time. Unlike the Williams Vix Fix or other oscillators that require a look-back period, Visual Velocity is observed in the present moment. It is the only "zero-lag" metric because it shows you what is happening as the candles form.
The Physics of Price Action Momentum
If a stock moves $2.00 in ten minutes, its velocity is higher than if it moves the same $2.00 over two hours. While a synthetic VIX might eventually catch up to this move, the visual trader has already identified the shift in market velocity. Trading without indicators isn't just about a cleaner chart; it's about reducing the cognitive load. As Investopedia emphasizes, successful day trading requires a trader to spot opportunities that can arise at any time. By focusing on how fast price is displacing, you gain an edge in execution speed.
Identifying Momentum Shifts: The Velocity vs. Volatility Framework
To move beyond the limitations of a synthetic vix indicator lagging behind the market, traders must master the distinction between "choppy" volatility and "directional" velocity.
- Choppy Volatility: High price fluctuations with low net progress. This often triggers lagging oscillators to show "oversold" signals prematurely, leading to false starts.
- Directional Velocity: High price change per unit of time with consistent follow-through. This is where price action momentum becomes visible.
How to Spot the Shift
Identifying a true momentum shift requires looking at "Fuel" and "Speed." A sustainable trend change occurs when the velocity ratio (current velocity divided by average ATR) is greater than 1.0, indicating the move has more "thrust" than recent noise. Additionally, velocity is most reliable during high-liquidity windows, such as the New York session. Signals occurring off-peak often lack the institutional backing seen in algorithmic market environments.
3 Actionable Strategies to Trade Visual Velocity

Instead of waiting for a volatility oscillator to print a peak, use these strategies to enter as momentum ignites.
1. The Impulse Rejection (V-Shape Recovery)
Identify a sharp, high-volume move that breaks a short-term support or the 20 EMA. While a lagging indicator might suggest a prolonged downtrend, look for an immediate "impulse rejection" where price aggressively reclaims the 20 EMA within a few candles. Enter long on the close back above the EMA, placing a stop below the "shakeout" low.
2. Contraction Breakouts with Liquidity Mapping
Markets transition from low volatility (contraction) to high velocity (expansion). Map "Buy-side Liquidity" above recent swing highs and wait for a breakout. A high-probability entry occurs when price breaks the zone with a wide-range "power candle," confirming the expansion phase.
3. The Velocity Add (Trend Compounding)
If an asset is up significantly and the slope remains steep, use the 20 EMA as a dynamic guide. If price tests the EMA and holds with a bullish confirmation candle, add to the position. Use a trailing stop at approximately 3.5x ATR to provide "breathing room" for the run.
🛡️ Strategy Selection Guide
| Strategy | Trigger Condition | Stop Loss Placement | Ideal Environment |
|---|---|---|---|
| Impulse Rejection | Aggressive reclaim of 20 EMA | Below "Shakeout" Low | Reversal / Bottoming |
| Contraction Breakout | Power Candle closing above zone | Below Breakout Candle | Trend Continuation |
| Velocity Add | Bullish hold of steep 20 EMA | Trailing 3.5x ATR | Strong Trend (Parabolic) |
Optimizing Your Setup: From Lagging VIX to Leading Price Action
Transitioning to a proactive style requires prioritizing the "speed of the tape." Professional setups often look at the relative strength of leading groups, such as growth vs. value, to gauge market health long before a volatility shock appears in the VIX.
To optimize your setup:
- Monitor Liquidity: Use market structure to identify where price is likely to "sweep" next.
- Leverage Sentiment: Use institutional positioning data to ensure your lower-timeframe entries align with "Smart Money" flow.
- Master Tape Speed: Watch how price reacts at institutional levels. When you stop waiting for a synthetic indicator to "confirm" a move and start reading the intent behind the candles, you move from a participant who reacts to a strategist who anticipates.
🛡️ Pro Tip: Don't let traps fool you. Learning to spot fake breakouts is key to trading velocity safely. Read our guide on The "Wick" Betrayal: How to Spot False Breakouts.
FAQ
Why does my synthetic VIX indicator miss the exact bottom of a crash?
Synthetic indicators rely on a look-back period (usually 20-22 days). Because they calculate the current price relative to the highest high of that period, the market must already be recovering for several bars before the mathematical formula "resets" or confirms the peak in fear.
Is the Williams Vix Fix still useful for modern day trading?
It remains a useful tool for identifying historical exhaustion levels on daily or weekly charts. However, for intraday trading, its inherent lag makes it less effective than observing raw price action momentum or Visual Velocity.
How can I measure "Visual Velocity" without a specific indicator?
You can measure it by comparing the distance traveled (in pips or points) against time. For example, a candle that covers 50 points in 1 minute has higher velocity than a candle that covers 50 points in 10 minutes. Many traders use the slope of a short-term EMA (like the 9 or 20) as a visual proxy.
What is "volatility buffering" and how does it affect my stops?
Volatility buffering refers to the mathematical smoothing used to hide market noise. In your trading, you can use a multiplier of the Average True Range (ATR) to create a "buffer" for your stop-loss, ensuring you aren't stopped out by minor fluctuations while the core velocity remains intact.
Explore More Trading Resources
Solved your immediate problem? Go deeper:
- Trading Psychology Guide - Why discipline fails and how architecture solves it
- Momentum Trading Guide - Pattern recognition and execution frameworks
- Speed Advantage Guide - Infrastructure that multiplies edge
Browse all resources: Trading Tools & Resources Hub
Ready to trade with zero friction? → Start on Manic.Trade