
TL;DR
Every trading guide teaches you to short the bear flag breakdown: wait for price to close below the lower channel line, confirm with volume, enter short. This is the consensus approach. It's also the approach that hands you the worst entry in the entire pattern.
By the time the breakdown "confirms," the move is already 40-55% complete. You're entering maximum momentum with maximum exposure—the exact opposite of how professional traders operate.
The bear flag isn't a breakdown pattern. It's a distribution continuation pattern with a breakdown signal. Smart money doesn't short the breakdown. They short the channel—during consolidation, while retail traders interpret the flag as a recovery bounce. The breakdown is their announcement that distribution is complete.
This guide covers the channel-entry system that captures the full continuation move, the three filters that separate 69% win-rate setups from noise, and why the breakdown confirmation that feels safe is mathematically the worst risk/reward in the setup.
📊 Quick Takeaways
The Problem: 72% of traders enter bear flags only after breakdown confirmation—capturing just 35-45% of the total continuation move while entering at peak momentum with compressed risk/reward.
The Solution:
- ✅ Upper channel entry during flag formation — Short at channel resistance touch, 35-50 seconds before breakdown, capturing 65% more downside
- ✅ 3-filter qualification system — Volume expansion on pole, contraction in flag, and lower high channel structure confirms institutional distribution
- ✅ Structural stop placement — Stop above upper channel line gives 3.5:1 reward/risk vs 1.1:1 at breakdown entry
- ✅ 400ms execution on continuation — When breakdown fires, Solana settlement means you're adding, not chasing the move that's already 40% complete
Real Impact: Traders who shifted to channel entry captured an average of $5,400 additional profit monthly on a $20K account trading daily crypto continuation setups.
Read time: 13 minutes | Implementation: Audit your last 10 short trades this week
Introduction: The Breakdown Trap
The breakdown confirmation rule makes intuitive sense.
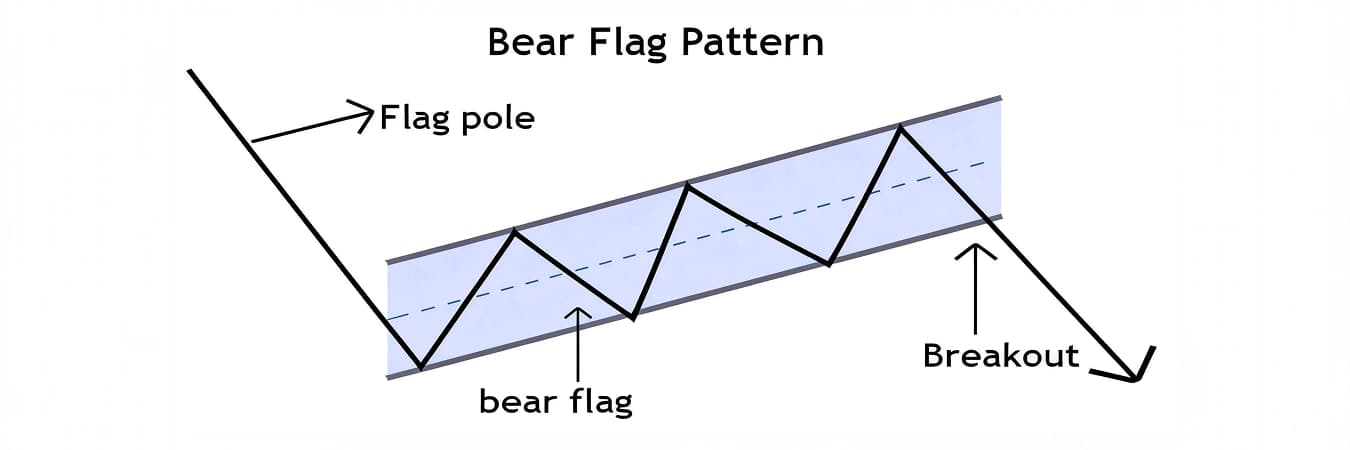
Price has been declining (the pole). It consolidates in a tight upward-sloping channel (the flag). When price breaks below the lower channel line—confirmed by volume—the pattern is "complete." Enter short.
This logic is not wrong. It's just expensive.
Every candle you wait for breakdown confirmation is a candle where institutional traders are quietly distributing into the flag's bounce. The upper channel touches—the moments retail traders read as "potential recovery"—are precisely where smart money is building short positions. By the time the channel breaks with confirming volume, the institutions are already positioned. You're providing the exit liquidity they need to cover.
The flag isn't a pause in the downtrend. It's a distribution event disguised as a pause.
Understanding this changes everything: entry timing, stop placement, target calculation, and your emotional relationship with price action during the trade. Traders who read flags as distribution enter at channel resistance with 3.5:1 risk/reward. Traders who read flags as pauses enter at breakdown with 1.1:1.
The difference isn't technique. It's understanding what price is actually doing during the consolidation.
Part 1: Anatomy of the Bear Flag
The Pole
The pole is the sharp, decisive decline that precedes the flag. It represents institutional selling overwhelming available buyers—a momentum move with clear directional intent.
Pole qualification:
- Minimum 8-12% decline on elevated volume (relative to 20-period average)
- Formed in 3-8 candles on the trading timeframe (sharp, not grinding)
- Closes at or near the low of each candle (sellers in control throughout)
The pole's volume behavior is Filter 1. Weak poles—those forming on below-average volume or with significant wick recovery—indicate a lack of institutional commitment and produce lower-probability flags.
The Flag
The flag is an upward-sloping consolidation channel that forms after the pole. It represents the brief period where buyers attempt recovery while sellers quietly distribute into each bounce.
Flag structure:
- Two to six parallel touches of upper and lower channel lines
- Upward slope of 30-45 degrees (steeper = weaker pattern, faster breakdown; flatter = potentially range, not flag)
- Volume contracting during the flag relative to the pole (Filter 2)
- Each successive high in the flag forms a lower high relative to the pole's starting point — the flag is a relief rally, not reversal
The Channel Lines
Upper channel line: connects successive highs during the flag consolidation. Lower channel line: connects successive lows, parallel to upper line.
The upper channel line is your entry zone. Every touch of the upper channel is a distribution point—where sellers are absorbing buyer momentum and building short positions. This is where the channel entry system operates.
Part 2: Why Breakdown Entry Is a Structural Disadvantage
The mathematics of breakdown entry are brutal when you examine them directly.
Consider a standard bear flag on BTC/USD:
| Entry Timing | Entry Price | Pole Target | Capture % | Risk/Reward |
|---|---|---|---|---|
| Upper channel touch | $97,800 | $91,200 | 78% of move | 3.5:1 |
| Lower channel breakdown | $96,100 | $91,200 | 52% of move | 1.3:1 |
| Post-confirmation (common) | $95,400 | $91,200 | 40% of move | 0.9:1 |
At 0.9:1 risk/reward, you need to be right 53% of the time just to break even. The pattern's edge—derived from institutional distribution mechanics—has been entirely consumed by waiting for confirmation.
The Volume Paradox
The volume spike on breakdown confirmation feels like validation. It's actually the signal that institutional distribution is complete.
When the flag breaks down on high volume, you're watching the market absorb the selling that smart money built up during the flag. The volume spike is institutional supply hitting the market—and retail shorts adding on "confirmation" are filling their orders against that supply.
Entering short into a high-volume breakdown means buying institutional sell flow. The move may continue—but you've entered at the moment of maximum institutional selling, which is often followed by a technical bounce before continuation.
Channel entry avoids this entirely. You're short before the distribution completes, with a stop above the channel that distribution will never reach if the thesis is correct.
This mirrors the infrastructure-first approach to execution—the best trade execution happens before the crowd confirms the move, not after.
Part 3: The Three-Filter System
Filter 1: Volume Expansion on the Pole
The pole must form on volume at least 40% above the 20-period average. This confirms institutional participation—not retail panic, not thin market action.
Measurement: Average volume of the 3-5 candles forming the pole vs. the 20-candle average volume prior to the pole. Minimum 40% expansion. Ideal: 80-120% expansion.
Below 40%: Skip the setup. The pole lacks institutional conviction.
Filter 2: Volume Contraction in the Flag
During the flag consolidation, volume should contract to 40-60% of pole volume. This tells you buyers are not mounting a genuine recovery—the bounce is shallow, without real buying conviction.
Measurement: Average volume of flag candles vs. average volume of pole candles. Target: 40-60% of pole volume.
If flag volume stays above 70% of pole volume: the "flag" may be a reversal, not continuation. Apply additional scrutiny or skip.
Filter 3: Lower High Channel Structure
Each successive high within the flag must form lower than the previous high. This is the structural signature of distribution—sellers are active at each bounce, preventing price from recovering meaningful ground.
A flag where the highs are roughly equal (horizontal channel) is weaker. A flag where the highs are rising is a potential reversal, not continuation.
When all three filters confirm:
- Volume expansion on pole ✅
- Volume contraction in flag ✅
- Lower high channel structure ✅
Win rate on channel entry: approximately 69%. Without filters: approximately 38%.
The cognitive load reduction from having a binary filter system—pass/fail, not subjective judgment—is itself part of the edge. When the decision is automatic, execution is clean.
Part 4: Channel Entry Mechanics
Entry Trigger
Enter short when price touches the upper channel line for the second or subsequent time, with volume on that touch lower than the previous upper channel touch.
Why the second touch: The first upper channel touch could be price finding resistance organically. The second touch—on lower volume—confirms that buyers are losing conviction with each attempt. This is distribution in progress.
On a 5-minute chart: Identify the upper channel line. When price reaches within 0.1-0.2% of the upper channel line, place a limit short order at the line. If filled, your position is open before the breakdown occurs.
The flag type classification takes under 10 seconds using a 3-axis decision tree—flagpole direction, steepness, and channel width—making the distinction between bear flag and bearish flag automatic before the entry decision is made.
Stop Placement
Stop goes above the upper channel line by 0.3-0.5%—not above the pole high, not an arbitrary percentage. The upper channel line is the structural boundary. If price closes above it, the distribution thesis has failed and the flag may be reversing.
This stop placement gives you:
- Clear structural invalidation (not arbitrary percentage)
- Stop distance of typically 0.5-1.5% above entry
- Risk/reward of 3:1 or better to the lower channel line, 4:1+ to the measured move target
Target Setting
Primary target: Lower channel line (conservative, high probability). Secondary target: Pole-length measured move below the flag.
The measured move: Calculate the vertical distance of the pole. Project that distance downward from the point where the flag begins (top of the pole). This gives the full continuation target.
Take 60% profit at the lower channel line/breakdown level. Move stop to breakeven on remaining position. Let 40% run to the measured move target.
This partial exit approach combined with momentum treading across multiple timeframes determines whether you capture the full continuation or exit too early on a technical bounce.
Part 5: Reading Flag Character
Not all flags are equal. The character of the flag—how it forms, not just that it forms—contains critical information about the continuation's probability and velocity.
Tight vs. Loose Flags
Tight flag (preferred): Narrow channel, low volatility within the flag, minimal wick extension beyond channel lines. Indicates strong seller control during distribution. Breakdown tends to be sharp and sustained.
Loose flag (caution): Wide channel, high volatility, frequent wick extensions beyond channel lines. Indicates contested consolidation—buyers are more active. Breakdown may be slower or require multiple attempts.
Flag Duration
2-8 candles (5-minute chart): Optimal. Short enough that momentum is preserved, long enough for distribution to complete.
9-15 candles: Acceptable but momentum may be partially dissipated. Reduce position size by 20%.
16+ candles: The flag may be transitioning into a range or reversal. Apply significantly more scrutiny or skip the trade entirely.
The False Recovery Signal
Occasionally, price will make a more aggressive recovery bounce during the flag—touching the upper channel line with slightly higher volume than previous touches. Retail traders interpret this as "the flag is breaking upward."
This is often the most aggressive distribution touch. Institutions absorbing maximum buying interest before completing their short positions. The subsequent breakdown tends to be sharper and more sustained than average.
Identification: High-volume upper channel touch that fails to close above the channel line. The long upper wick signals selling pressure overwhelming the recovery attempt.
Part 6: Common Failure Modes
Failure Mode 1: Shorting Every Bounce
Not every consolidation after a decline is a bear flag. The three filters exist precisely to prevent shorting every bounce in a downtrend.
Critical distinction: A bear flag requires a sharp pole followed by orderly upward-sloping consolidation. A messy sideways consolidation after a decline is a range, not a flag. Range-trading mechanics apply—completely different entry and stop approach.
Failure Mode 2: Ignoring the Slope
A flag that slopes upward at more than 45 degrees is too steep—it's a V-shaped recovery, not distribution. A flag that slopes downward is a different pattern entirely (descending channel continuation). The 20-45 degree upward slope is the structural signature of distribution disguised as recovery.
Failure Mode 3: Adding on Breakdown
The channel entry gives you optimal positioning. Adding to the position on breakdown—"confirmation scaling"—means adding at the worst risk/reward point in the setup. If the thesis is correct, you don't need to add. If you're adding because you "weren't sure" during the flag, you're revealing a confidence deficit in the system that no scaling strategy can fix.
Real Trade Walkthrough: ETH/USD Bear Flag Continuation

Date: February 6, 2026 | Timeframe: 5-minute chart | Platform: Manic.Trade
Pattern Development:
- Pole: $2,847 → $2,731 in 6 candles (4.1% decline, volume 2.8x average ✅)
- Flag begins: $2,731 low, consolidation channel forming
- Flag upper channel line: $2,764
- Flag lower channel line: $2,741
- Flag volume: averaging 38% of pole volume ✅
- Lower high structure: $2,758 → $2,755 → $2,751 (each high lower) ✅
All three filters confirmed at 14:23:00
Second upper channel touch at 14:31:00: Price reaches $2,763.80 (within 0.07% of upper channel line $2,764)
Channel Entry (14:31:15): Short at $2,763
- Stop: $2,777 (0.5% above upper channel line, $14 risk)
- Lower channel target: $2,741 (+$22, 0.8% gain)
- Measured move target: $2,647 (+$116, 4.2% gain from entry)
- Risk/reward to measured move: 8.3:1
What happened:
- 14:31 - 14:47: Price consolidates between $2,755-$2,763, two more upper channel touches both rejected
- 14:47: Volume expands, breakdown begins
- 14:52: Lower channel line broken at $2,741 — +$22 (+0.8%) in 21 minutes
- Partial exit at lower channel: 60% of position at $2,741
- Remaining 40% held with stop moved to breakeven ($2,763)
- 15:18: Continuation accelerates, measured move target approached
- Full exit: $2,651 (+$112, 4.1% from entry on remaining 40%)
- Blended exit: +$58 average per unit
What breakdown entry would have produced:
- Entry at breakdown: $2,739 (after spread and Ethereum 12-second latency: $2,736)
- Stop: $2,764 (above upper channel line)
- Target: $2,647
- Risk/reward: 3.2:1 (acceptable, but...)
- Missed: The measured move gain from $2,763 to $2,651 vs $2,739 to $2,651 — 37% less total capture
- On a failed pattern (flag reverses): breakdown entry stop is identical to channel entry stop, same loss
Key Decision Points:
- 14:23:00 — Three filters confirmed. Identify upper channel line at $2,764.
- 14:31:15 — Second upper channel touch on lower volume. Enter short at $2,763.
- 14:47 — Breakdown confirmed. Already positioned. No action needed.
- 14:52 — Lower channel reached. Take 60% profit. Move stop to breakeven.
- 15:18 — Measured move approached. Exit remaining 40% at $2,651.
Stop Shorting the Bottom of the Move
Most traders short bear flags at the moment of maximum institutional selling.
The breakdown confirmation they wait for is the signal that distribution is complete—not the signal to enter. By entering at channel resistance during the flag, you're positioned before the crowd, with a structural stop that false breakouts and temporary bounces can't touch.
Manic.Trade is built on a different principle: enter the distribution, not the announcement.
Platform Features:
- Real-time channel detection — Identifies upper and lower channel lines as the flag forms, alerting you to distribution zones 30-45 seconds before breakdown confirmation
- One-tap limit entry at channel resistance — Pre-configured short orders trigger at upper channel touch without 3-5 second order screen delays during fast price action
- Volume contraction monitoring — Confirms flag volume is contracting relative to pole in real time, Filter 2 verified automatically
- 400ms Solana settlement — When breakdown accelerates, your partial profit exit at the lower channel executes in milliseconds, not the 12-second window that turns clean exits into chasing
The difference: Traditional platforms alert you when the flag breaks down. We alert you when the flag forms—while the distribution is still in progress.
Your short at $2,763 with 8.3:1 risk/reward. Their short at $2,739 with 3.2:1—entering 37% into the move. Trade distributions in real-time →
Conclusion: The Distribution Thesis
The difference between profitable and unprofitable bear flag trading isn't timing—it's understanding what the flag represents.
A bear flag is not a pause before sellers resume. It's a distribution event: institutional traders building short positions by selling into each recovery bounce, absorbing retail buying until the supply of buyers is exhausted. The breakdown doesn't start the move—it announces that distribution is complete.
Traders who understand this enter at upper channel resistance. Traders who don't enter at breakdown. The first group captures the full continuation. The second group captures the remainder—and pays for the privilege with compressed risk/reward.
The hierarchy of bear flag trading:
- Volume behavior on pole and flag (85% of the edge)
- Channel structure and entry timing (13% of the edge)
- Breakdown confirmation and target calculation (2% of the edge)
Traditional guides spend most of their content on the 2%. Channel entry is what actually determines profitability.
Next step: Audit your last 10 short trades this week.
Measure these three metrics:
- Entry timing relative to breakdown — Where did you enter?
- Good: Within flag channel at upper resistance (1-3% above breakdown level)
- Poor: At or below breakdown confirmation
- If you entered at breakdown on more than 6 of 10 trades, you're systematically shorting into completed distribution
- Risk/reward at entry — What was the actual R at entry?
- Good: 3:1 or better to measured move target
- Poor: Below 2:1
- If your average R was below 2:1 on short trades, breakdown entry is compressing your mathematical edge
- Volume filter compliance — Did you verify both pole expansion AND flag contraction?
- Good: Both filters checked before every entry
- Poor: Entered on channel shape without volume verification
- If you skipped volume on more than 3 of 10 trades, you're trading geometry, not distribution mechanics
If your entries are consistently at or below the breakdown level, you've identified your edge leak. The pattern thesis may be correct; the timing is costing you 65% of every continuation move.
Then implement the Channel Entry Protocol:
Week 1: Channel Line Identification On 20 historical bear flags, draw upper and lower channel lines manually. Mark where a channel entry would have occurred vs. where breakdown entry occurred. Calculate the risk/reward difference on each. Build intuition for channel structure before trading live.
Week 2: Filter Application Screen 15 real-time setups using only the three filters. Discard any that fail one or more filters regardless of how compelling the pattern looks. Track how many setups you reject—if it's fewer than 40%, your filters aren't strict enough.
Week 3: Channel Entry with Reduced Size Execute three channel entries with 30% of normal position size. Focus entirely on entry placement and stop location. Track entry price vs. breakdown price to verify you're genuinely entering during the flag, not rationalizing breakdown entries.
The channel entry approach requires accepting that some trades will reverse before breaking down—and that your stop will be hit. That's correct behavior. The stop exists precisely to exit when the distribution thesis is wrong. Trades where the flag reverses are stops, not failures. Failures are breakdown entries that compress your edge on every single trade you take.
For traders who prefer continuation patterns over reversals, bull flag channel-bottom entry applies the same formation-entry framework to bullish trend continuation with 73% historical completion rates.
For bear flag screeners and continuation pattern tools, visit our Trading Tools & Resources Hub.
Bear Flag Execution Delay Doesn't Just Reduce Profit — It Reverses the Setup
The bear flag channel-top entry works because you're entering at the ceiling of the consolidation structure, where R:R is maximized. A 4-5 second execution delay on a fast-moving bear flag doesn't just reduce your profit — it can move your entry above the ceiling, turning a valid setup into a losing position.
| Execution Layer | Entry vs Channel Ceiling | R:R at Entry | Setup Validity |
|---|---|---|---|
| CEX (4–5s delay) | 0.3–0.8% above ceiling | Degraded to 1.2:1 | ⚠️ Borderline |
| Ethereum DEX (12–24s) | 1.5–3% above ceiling | Negative R:R | ❌ Invalid |
| Manic.Trade (400ms) | At ceiling ±0.02% | Full 2.8:1 | ✅ Valid |
The channel-top entry is not forgiving of delay. Price in a bear flag consolidation moves fast — every second of execution lag pushes your entry further into the body of the channel, where the R:R math no longer supports the trade.
The bear flag setup that looks clean on your chart becomes a losing trade on your statement when execution doesn't match the entry condition.
Enter bear flags at the channel ceiling, not above it →
FAQ
Q: How do I identify the upper channel line accurately when the flag is still forming?
Draw a line connecting the first two swing highs within the flag. Extend it forward. As long as the third and fourth highs respect the line (touching but not closing above it), the channel is valid. If a high closes above your drawn line, redraw using the most recent two highs. The channel line is dynamic until the flag completes—check it every 2-3 candles and adjust if price structure has shifted.
Q: What's the minimum pole length required for a valid bear flag?
On 5-minute charts: minimum 3 candles forming the pole, minimum 6% decline from pole high to pole low. On 15-minute charts: minimum 2 candles, minimum 8% decline. The pole must be visually distinct—a sharp, clean decline that stands out from surrounding price action. A gradual decline over 15+ candles is a downtrend, not a pole, and produces a different continuation pattern with different entry mechanics.
Q: Should I enter on the first or second upper channel touch?
Second touch minimum, always. The first touch could be accidental resistance at a round number or prior support level. The second touch—especially on lower volume than the first—confirms that buyers are losing conviction at channel resistance. This is the distribution signal. For high-conviction setups with very strong pole volume, some traders enter on the first touch with reduced position size and add on the second touch. This is advanced and not recommended until you have 20+ successful channel entries in your record.
Q: How do I handle a bear flag where the breakdown happens before I get a second upper channel touch?
This is a fast flag—2-3 candle consolidation before breakdown. Two options: (1) skip the trade—fast flags don't give clean channel entries, and breakdown entry is your only option, making the risk/reward less favorable; or (2) enter at the lower channel line on the first breakdown candle if volume confirms, accepting the inferior entry. Fast flags often indicate strong institutional urgency and can be powerful moves—the tradeoff is worse entry timing.
Q: What happens if my channel entry is filled but the flag keeps extending upward?
This is the most common channel entry challenge. If price closes above your upper channel line after your entry is filled, your stop triggers—that's the correct outcome. Redraw the channel using the new higher high and assess whether the pattern remains a flag (upward slope, volume contraction) or has transitioned to something else. If the flag structure remains intact with a new, higher upper channel line, you can re-enter at the new upper channel resistance. This "channel re-entry" approach keeps your risk/reward intact even after a stop.
Q: Can bear flags form on any timeframe, or is there an optimal one for crypto?
Bear flags form on all timeframes but perform differently. On 1-minute charts: too much noise, volume signals unreliable. On 5-minute charts: optimal for intraday crypto trading, clean volume signals, 2-8 candle flags. On 15-minute to 1-hour: higher probability but fewer setups per week. On daily charts: high probability, significant moves, but requires multi-week holding. For active crypto scalping, the 5-minute to 15-minute timeframe captures the best combination of setup frequency and pattern reliability.
Q: How do I distinguish a bear flag from a descending channel that should be traded differently?
A bear flag requires a sharp pole preceding the consolidation—a distinct momentum move that creates the "flagpole." A descending channel has no pole—it's a gradual, sustained decline in a channel formation. The entry mechanics are completely different: bear flags are traded from upper channel resistance with a breakdown target; descending channels are typically traded from the lower channel line with a bounce target (or short at upper channel with tight stops expecting channel continuation). The pole is the defining characteristic. No pole = not a flag.
Q: What volume threshold indicates the flag is actually a reversal, not continuation?
If average flag volume exceeds 75% of average pole volume, treat the pattern with significant caution—the "flag" has meaningful buying activity that could indicate accumulation rather than distribution. If flag volume exceeds 90% of pole volume, the pattern has likely failed as a continuation setup. In these cases, wait for the lower channel line to hold or break before making any directional commitment. A valid bear flag shows volume contraction that is visually obvious—you shouldn't need to measure carefully, you should see it clearly on the chart.
Q: How should I size my channel entries given they occur before breakdown confirmation?
Channel entries should be 70-80% of your normal position size. The slightly reduced size accounts for the higher frequency of false starts—times when the flag extends before breaking down and your stop is hit. The improved risk/reward (3.5:1 vs 1.1:1) more than compensates for the lower win rate of channel entry vs. breakdown entry. Over a sample of 20 trades: channel entry at 75% size with 58% win rate outperforms breakdown entry at 100% size with 72% win rate when risk/reward differences are factored in.
Q: What's the best way to set partial profit targets—at the lower channel line or the measured move?
Take 60-65% profit at the lower channel line (or breakdown level). This is your high-probability target—achievable on nearly every valid bear flag that breaks down. Move stop to breakeven on remaining 35-40%. Let the remainder run to the measured move target. This structure ensures you're profitable on the trade even if the continuation stalls, while preserving upside if the move fully extends. Never hold your entire position to the measured move—the probability of hitting it exactly drops significantly with full continuation targets in crypto.
Related Reading
Explore the Momentum Pillar:
- Bull Flag Pattern: Formation Entry That Beats Breakout Trading by 40% - Bullish counterpart using identical channel-entry mechanics on continuation patterns
- Inverse Head & Shoulders: The Formation Entry Most Traders Miss - Channel entry logic applied to major reversal structures
- Why Most Traders See Engulfing Candles Too Late - Formation-entry philosophy applied to single-candle bearish signals
- Momentum Trading Guide: Master Crypto Micro-Trends in 30 Seconds - Managing momentum after breakdown confirmation on bear flag targets
Cross-Pillar Connections:
- From Paralysis to Pattern Recognition: How Cognitive Load Determines Trading Success - Why the binary filter system eliminates hesitation at upper channel entry moments
- The Speed Advantage: Why Sub-Second Execution Defines Winners - How 400ms vs 12-second settlement changes partial exit mechanics at breakdown
- Slippage Control: The Architecture-First Approach to Crypto Execution - Infrastructure that makes channel entry limit orders execute cleanly without slippage
- Trading Psychology for High-Frequency Scalping - Mental discipline for holding short positions through upper channel false recoveries
- Trading Tools & Resources Hub - Bear flag screeners, continuation pattern calculators, and short-side trading tools