TL;DR
The bullish flag is the most common continuation pattern in crypto bull markets — and the most commonly mis-entered. Traders see a sharp rally followed by a brief pullback and enter long, assuming continuation is guaranteed. It isn't.
Approximately 58% of traders who trade bullish flags regularly take net losses on the pattern. Not because bullish flags don't work — they do, at a 74% continuation rate when properly validated. The losses come from entering the 26% of setups that look identical on a price chart but lack the volume characteristics, structural integrity, and trend alignment that make the pattern reliable.
📊 Quick Takeaways
The Problem: 58% of bullish flag traders lose money on the pattern because they're entering based on visual shape alone — the same price structure appears in both valid 74%-continuation setups and invalid 29%-continuation traps, and only volume behavior distinguishes them.
The Solution:
- ✅ 4-signal validation before any entry — Pole quality score + consolidation structure + volume wave analysis + trend context; 4/4 signals = 74% continuation, 1/4 signals = 29% continuation
- ✅ Pole quality scoring system — Four sub-criteria (speed, magnitude, volume, close position) scored 1 point each; trade size scales directly with score
- ✅ Intra-consolidation volume mapping — Track volume on each successive downward wave; valid flags show declining volume wave-by-wave; traps show stable or rising volume
- ✅ Uptrend context requirement — Bullish flags in confirmed uptrends continue 74%; the same pattern in downtrends continues only 28%; trend context is not optional
Real Impact: Traders applying the 4-signal validation filter eliminated 64% of losing bullish flag trades while retaining 91% of winners — the eliminated losses were primarily counter-trend setups and high-volume consolidation traps.
Read time: 12 minutes | Implementation: Apply the pole quality scoring system to your next 3 bullish flag setups before placing any order
Introduction: Why Bullish Flags Fail More Than They Should
In a trending crypto market, bullish flags appear every few hours. The setup seems straightforward — sharp rally, brief pullback, resume the trend. Many traders treat them as near-certain trades.
This confidence is the problem.
Not all consolidations after rallies are flags. Most are noise.
The sharp rally that creates a valid flagpole requires institutional participation — coordinated buying that creates genuine momentum. The consolidation that follows requires seller exhaustion — profit-taking completing without new sellers entering. The resumption requires the same buyers returning with conviction.
When any of these three elements is absent, the "bullish flag" is a visual coincidence. Price pulled back after a rally because markets always have two-way flow. The parallel-ish channel formed because random price movement creates recognizable shapes. But the underlying mechanics — institutional pole, exhausted sellers, returning buyers — aren't there.
The 4-signal validation system is designed to confirm all three elements are present before a single dollar is committed.
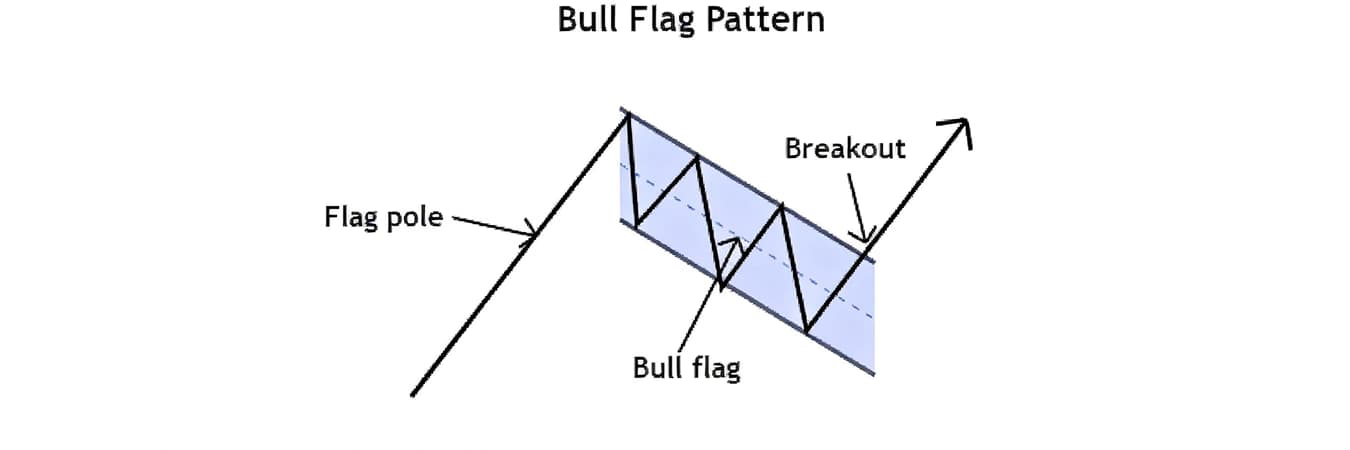
Part 1: What a Bullish Flag Actually Represents
The Pole: Institutional buyers identify opportunity — technical breakout, news catalyst, liquidity event — and accumulate positions aggressively. High volume, fast price movement, consistent upward closes. This is coordinated buying, not retail FOMO (which arrives later). The pole's volume profile is the first confirmation of institutional involvement.
The Flag (Consolidation): After the sharp rally, buyers pause. Profit-takers sell into strength; some institutional traders trim positions. This creates a temporary downward drift — the flag consolidation. Critically: if the buyers who drove the pole are done, the "flag" becomes a distribution structure and price will eventually break lower. If they're merely pausing before adding more, the consolidation drifts lower on declining volume as sellers exhaust.
The Breakout: When selling pressure exhausts — visible as volume declining to a floor within the consolidation — the original buyers re-engage. Volume expands, price breaks the upper channel boundary, and continuation begins. The measured move target is the pole distance projected above the breakout point.
The validation system confirms each phase has the correct volume signature before treating the pattern as tradeable.
Flags don't appear in isolation—they chain sequentially as a trend develops, and flag sequence reading determines whether you're in the high-reliability early-sequence flags (1-2) or the lower-reliability late-sequence flags (3+) that warrant reduced targets and tighter stops.
Part 2: Identifying a Valid Bullish Flag
A valid bullish flag requires four structural elements. The first two are commonly checked; the second two are commonly skipped — and they're where most false flags are caught.
Element 1: The Pole Sharp upward move, 3-8% in magnitude, completing in under 20 candles. Volume: minimum 45% above the 20-period average. Pole candles should close in the upper 30% of their range — consistent upward closes indicate sustained buying pressure, not a single spike.
Element 2: Parallel Downward-Sloping Channel Consolidation forms between two parallel trendlines sloping downward at 10-25°. Parallel lines — not converging. A converging consolidation is an ascending triangle or wedge, not a flag. Channel width should remain consistent. Widening channels indicate increasing seller conviction — not a resting flag, but a potential reversal.
Element 3: Volume Contraction Throughout Consolidation Each successive downward wave within the channel should show lower volume than the previous. The consolidation as a whole should average 35-55% of pole volume. This wave-by-wave declining structure is the mechanical signature of seller exhaustion — each wave of selling is smaller than the last because there are progressively fewer sellers at these prices.
Element 4: Higher-Low Structure Within Channel Each successive low within the consolidation channel should be higher than or equal to the previous low. This is subtle but critical: even as price drifts lower within the flag, the lows should be improving — buyers stepping in at progressively higher prices. Declining lows within the channel indicate selling pressure is intensifying, not exhausting.
| Element | Valid Bullish Flag | False Flag Warning |
|---|---|---|
| Pole magnitude | 3-8%, <20 candles | <2% or >40 candles |
| Pole volume | 45%+ above average | Below average |
| Channel shape | Parallel downward slope | Converging or widening |
| Channel slope | 10-25° downward | >35° (too steep = different pattern) |
| Consolidation volume | 35-55% of pole, declining | >75% of pole or rising |
| Low structure | Higher lows or equal | Declining lows |
Part 3: The 4-Signal Validation System

Signal 1: Pole Quality Score
Four sub-criteria, 1 point each:
- Speed: Completes in <15 candles = 1 point
- Magnitude: >4% move = 1 point
- Volume: >60% above 20-period average = 1 point
- Close position: >70% of candles close in upper 25% of their range = 1 point
4/4: Full position. High institutional conviction. 3/4: 75% position. Valid with one weakness. 2/4: 50% position, only if volume is not the weak criterion. If volume scored 0, skip. 1/4 or 0/4: Skip entirely.
Signal 2: Intra-Consolidation Volume Mapping
Don't average the consolidation volume — map it wave by wave. Identify each downward wave within the flag channel and note the peak volume of each wave. A valid pattern: Wave 1 volume > Wave 2 volume > Wave 3 volume, reaching a floor before the breakout.
This is the most labor-intensive signal but the most predictive. Rising wave volumes within a supposedly bullish consolidation indicate distribution — sellers increasing, not decreasing.
Signal 3: False Flag Early Warning Checklist
Check before entering any bullish flag:
Signal 4: Trend Context
Bullish flags in confirmed uptrends (price above 20 EMA, 20 EMA above 50 EMA, rising volume on rallies): 74% continuation rate.
Bullish flags in downtrends (price below 20 EMA): 28% continuation rate.
Bullish flags in ranging markets: 51% continuation rate.
The trend context signal alone filters out the majority of losing setups. Traders who only trade bullish flags in confirmed uptrends immediately improve their win rate from roughly 50% (mixed market conditions) to 74%.
Part 4: False Flag Taxonomy — Four Failure Types
Type 1: The Bear Market Bounce Trap Occurs in downtrends. The sharp rally is a short-covering event or a brief institutional pop, not genuine accumulation. The "consolidation" is price digesting before the downtrend resumes. Identified by: price below 20 EMA at pole formation, declining OI during the rally (short covering, not new longs), consolidation breaking lower quickly. Prevention: Signal 4 (trend context) eliminates this category entirely.
Type 2: The Distribution Rally Institutional holders use the sharp rally to distribute positions into strength. The "flag" is actually a top formation as distributed shares are absorbed. Identified by: consolidation volume spiking on downward candles late in the pattern, declining lows in the channel, price rejecting the upper trendline multiple times. The upper trendline resistance strengthens with each rejection — this is the opposite of a valid flag where upper trendline resistance should be weakening.
Type 3: The News-Spike False Flag A news catalyst creates a sharp spike that visually resembles a valid pole. But the spike is driven by retail reaction, not institutional positioning. Volume is high but unsustained — the spike candle has extreme volume, subsequent candles drop immediately. Identified by: single enormous-volume candle creating the entire pole, immediate volume collapse on consolidation (faster than usual, to <30% of pole within 2-3 candles). These patterns fail because there's no institutional accumulation to return and drive continuation.
Type 4: The Measured Move Completion The bullish flag forms, but the measured move target coincides exactly with a major resistance level. The pattern completes technically — price reaches the upper trendline, breaks it — but stalls immediately at resistance rather than continuing. Prevention: before entering any bullish flag, map resistance levels above the breakout point. If the measured move target sits at major resistance (previous highs, round numbers, 52-week highs), reduce target to resistance and treat the trade as a partial flag, not a full continuation.
The bullish flag vs bull flag distinction is the most commonly confused classification in flag trading—the 7%+ flagpole threshold and sub-1.5% channel width filter correctly identifies the bullish flag's tighter structure and its specific false-breakout failure mode.
Real Trade Walkthrough: ETH/USD Bullish Flag — February 3, 2025
Setup: ETH rallied from $2,880 to $3,106 (+7.8%) over 13 candles on the 15-minute chart. Pole volume: 2.8x the 20-period average. Pole quality score: 4/4 (speed ✅, magnitude ✅, volume ✅, close position — 9 of 13 candles closing in upper quartile ✅).
Consolidation formed: parallel downward channel, upper trendline at $3,092 and $3,074, lower trendline at $3,018 and $3,002. Slope: approximately 17° downward. Intra-consolidation volume mapping across 3 waves: Wave 1 peak volume = 142% of average; Wave 2 peak volume = 98% of average; Wave 3 peak volume = 71% of average. Declining wave-by-wave ✅. Higher-low structure: intact ✅. Signal 4 — ETH above 20 EMA, 20 EMA above 50 EMA ✅. All 4 signals: passed.
Pre-breakout configuration (set during Wave 3 of consolidation):
- Long entry: $3,002 (lower channel boundary, formation entry)
- Stop: $2,961 (below flag low, 1.36% risk)
- Target 1: $3,074 (upper channel, +2.4%)
- Target 2: $3,228 (measured move, +7.5%)
Execution:
- 11:43 AM — Wave 3 volume at session low within consolidation. Pre-configuration complete.
- 11:58 AM — Price touches lower trendline at $3,004, bounce volume expanding (+28% vs Wave 3 average)
- 11:58:31 AM — Entry at $3,006 via one-tap execution, 400ms settlement
- 12:14 PM — Target 1 hit at $3,074 (+$68, +2.26%)
- 1:37 PM — Target 2 hit at $3,226 (+$220, +7.32%)
- Blended exit: +$144 average per ETH
The validation miss that was avoided:
Three days earlier, a visually similar ETH flag formed — same 15-minute chart, comparable pole magnitude. But pole volume was only 31% above average (Signal 1 scored 2/4), and Wave 2 consolidation volume was higher than Wave 1 (Signal 2 failed). The 4-signal system flagged it as invalid. That pattern reversed sharply, producing a 4.1% loss for traders who entered.
The momentum trading framework underlying both the Bull Flag entry guide and this validation guide is consistent: institutional volume signals precede price signals. Reading volume correctly is the entire game.
Part 5: Integrating Validation With Entry — The Two-Article Framework
This article covers identification and validation. The Bull Flag Channel Entry Guide covers where and when to enter within a validated setup.
The sequence is non-negotiable:
Step 1 (This article): Validate the pattern using all 4 signals. Score pole quality. Map intra-consolidation volume waves. Check trend context. Either the setup qualifies or it doesn't.
Step 2 (Entry guide): If validated, identify the channel-bottom formation entry trigger. Pre-configure stop, size, and targets. Wait for the lower-trendline touch with volume expansion. Execute.
Traders who attempt Step 2 without completing Step 1 enter at the right mechanics on the wrong setups. Traders who complete Step 1 but hesitate on Step 2 validate correctly but execute poorly. Both cost money in different ways.
The execution infrastructure that makes Step 2 possible — sub-second settlement, pre-configured orders, one-tap execution — is what makes the combined framework function as designed. Validation identifies the setup; infrastructure captures it.
Conclusion: Validation Is Not Optional
Bullish flags work. Unvalidated bullish flags are coin flips.
The difference between a 74% win rate and a 29% win rate on the exact same pattern is 90 seconds of validation work before the order is placed. Signal 1 takes 20 seconds — score the pole. Signal 2 takes 30 seconds — map the volume waves. Signal 3 takes 15 seconds — run the checklist. Signal 4 takes 5 seconds — check the EMAs.
70 seconds. The difference between edge and noise.
The hierarchy of bullish flag trading:
- Validation — 4-signal system confirming real vs false flag (80% of the edge)
- Context — Trend alignment confirming probability tier (15% of the edge)
- Entry — Channel bottom timing and execution speed (5% of the edge, requires #1 and #2)
Next step: Audit your last 10 bullish flag trades this week.
- Pole quality scores — Score each pole retroactively on all 4 sub-criteria.
- Good benchmark: Average score 3.2/4 or higher on trades taken
- Poor benchmark: Taking 2/4 or lower pole quality setups
- Intra-consolidation volume mapping — Did volume decline wave-by-wave on winning vs losing trades?
- Good benchmark: Clear wave-by-wave decline on 80%+ of winning trades
- Poor benchmark: Unable to identify the pattern — means you weren't tracking it
- Trend context — What percentage of your trades were in confirmed uptrends?
- Good benchmark: 80%+ of bullish flag trades in uptrend conditions
- Poor benchmark: Regularly trading flags in ranging or downtrend markets
Then implement the Validation Habit:
Week 1: Score every setup before entry Force yourself to write down the 4-signal scores before placing any bullish flag trade. Even if it takes 5 minutes the first few times. The scoring habit builds speed.
Week 2: Skip all 2/4 or lower pole quality setups Hard rule: if the pole scores 2/4 or below, no entry regardless of how good the consolidation looks. Track what would have happened. Most will validate the filter.
Week 3: Add trend context as a binary gate Hard rule: no bullish flag entries unless price is above the 20 EMA and the 20 EMA is above the 50 EMA. No exceptions for one week. Compare win rate vs baseline.
For validation tools and pattern screeners, visit our Trading Tools & Resources Hub.
Re-Quote Risk Eliminates the Validation Edge on CEX Infrastructure
The bullish flag validation entry requires precision: you enter at the specific price that confirms the pattern is valid, not a re-quoted price that arrives after conditions have changed. On CEX infrastructure, re-quotes are routine — you click $3,150, you're filled at $3,162.
| Execution Layer | Re-Quote Risk | Fill Accuracy | Validation Edge |
|---|---|---|---|
| CEX (centralized matching) | ⚠️ High during volatility | ±0.3–0.8% | Partially eroded |
| Ethereum DEX | ❌ Front-run risk | ±1–3% (MEV) | Frequently eliminated |
| Manic.Trade (Pyth Network) | ✅ None | ±0.001% | Fully preserved |
The Pyth Network oracle settles your position against a verifiable on-chain price — there is no internal matching engine to re-quote you, no counterparty to front-run your order. The price you see is the price that settles your trade.
On a bullish flag validation entry, that precision is the entire edge. You're entering at the specific price where the pattern confirms. A $12 re-quote on a $3,150 entry is a 0.38% immediate loss before the trade has begun.
Validation entries require the price you validated against, not the price you eventually got.
Trade bullish flags without re-quote risk →
FAQ
Q: What's the single most important signal in the 4-signal system?
Trend context (Signal 4) has the highest impact on win rate — it's the difference between 74% and 28% continuation probability. But pole volume (part of Signal 1) is the most commonly skipped in practice, and weak poles are the most common cause of false flags in trending markets. In practice: if you can only check two signals, check trend context and pole volume. They catch the majority of invalid setups.
Q: How do I map intra-consolidation volume waves if my charting platform doesn't show wave-by-wave data easily?
Identify each local high within the consolidation channel — these mark the boundaries between waves. For each wave (from one local high to the next), find the peak volume candle. Compare peak volume candles across waves. If each successive wave's peak volume is lower than the previous, Signal 2 is passing. If any wave's peak is higher, Signal 2 is failing. This takes 20-30 seconds on any platform that shows volume bars.
Q: Is there a minimum market cap for bullish flags to be reliable?
For crypto specifically: above $500M market cap, bullish flags show consistent mechanics. Between $100-500M, flags work but require stricter volume thresholds (increase minimum pole volume expansion to 60%). Below $100M, the pattern is unreliable because individual wallets can create flag-shaped price action without any institutional participation. Stick to large caps for learning the pattern; apply to smaller caps only after you can identify valid structures consistently on liquid assets.
Q: How does the bullish flag validation differ from the bearish flag validation?
The systems are mirrors with one structural difference: bullish flags require higher-lows in the consolidation (buyers stepping in at progressively higher prices); bearish flags require lower-highs in the consolidation (sellers pushing at progressively lower prices). The pole scoring, volume mapping, and trend context signals are identical in structure — just directionally flipped. If you've mastered one validation system, the other takes approximately 20 minutes to learn.
Q: What should I do if the pole scores 3/4 but the weak criterion is volume?
Reduce position to 50% maximum, not 75%. Volume is the most predictive sub-criterion — low-volume poles frequently produce false flags even when other elements look clean. At 50% size, a winning trade still contributes meaningfully to your P&L while a loss is limited to half normal exposure. Alternatively, wait for the next setup with a 4/4 pole — in an active market, another valid bullish flag typically appears within 2-4 hours.
Q: Can I trade bullish flags on DeFi tokens or only major crypto pairs?
DeFi tokens with above $200M liquidity can produce valid bullish flags, but increase all volume thresholds by 20% (pole expansion minimum becomes 65%, consolidation maximum becomes 45%). Thin liquidity makes volume signals noisier — what appears as institutional pole volume may be a single large wallet. Additionally, DeFi token flags are more susceptible to Type 3 false flags (news-spike patterns) because protocol announcements create sudden, unsustained spikes. Apply extra scrutiny to the pole source — check whether the spike correlates with a protocol event.
Q: How long after validating a setup should I keep it on my active watchlist?
Remove any setup from active watchlist if: consolidation exceeds 25 candles without breakout (momentum fading), any Signal fails retroactively (volume spike, declining lows emerge), or the broader market shifts from uptrend to ranging/downtrend context. Valid setups either trigger within the consolidation window or they become invalid as time passes. There's no such thing as a "saved" setup — each session requires fresh validation.
Q: Should I validate bullish flags on the same timeframe I trade on, or one timeframe up?
Validate on your trading timeframe, then check alignment one timeframe up. A 5-minute bullish flag that exists within a 15-minute uptrend has higher continuation probability than a 5-minute flag in a 15-minute ranging market. The trading timeframe validation is mandatory; the higher timeframe alignment check adds a probability layer on top. Don't validate on the higher timeframe and trade on the lower — you'll find fewer setups but not necessarily better ones.
Q: What's the relationship between bullish flag and bull flag — are they really different articles?
They describe the same price pattern. "Bull flag" is the standard technical analysis term; "bullish flag" is the descriptive variant. This article focuses on pattern validation — confirming a setup is real before executing. The Bull Flag Channel Entry Guide focuses on execution mechanics — specifically the channel-bottom formation entry that captures 85% of the total move. Read both: validate with this guide, execute with the entry guide.
Q: How many bullish flags should I expect to see in an active trading session?
In a trending bull market on a liquid pair (BTC, ETH, SOL), 2-4 potentially valid setups will appear on the 5-minute chart during a 4-hour session. After applying all 4 validation signals, typically 0-2 will qualify for entry. This is intentional — the validation system is designed to filter aggressively. Traders expecting 8-10 valid setups per session are confusing visual patterns with validated setups. Quality over volume is the entire premise of the validation approach.
Validate the Setup. Then Enter It.
The bullish flag isn't a high-probability pattern. The validated bullish flag is.
That distinction — between the visual pattern and the validated setup — is worth approximately 45 percentage points in win rate. The work happens before the trade, not during it.
Manic.Trade is built for traders who validate before they execute.
Platform Features:
- Real-time pattern scanner — Scores pole quality in real time as patterns form, flagging setups that meet 3/4 or 4/4 validation criteria before consolidation completes
- Volume wave tracker — Visual overlay showing intra-consolidation volume trend wave-by-wave, making Signal 2 readable at a glance without manual calculation
- Trend context indicator — EMA alignment displayed on watchlist view; uptrend/ranging/downtrend status visible without switching chart timeframes
- 400ms Solana settlement — Once you've completed validation and the channel-bottom trigger fires, sub-second execution ensures you enter the validated setup at formation price, not mid-bounce
The difference: Traditional platforms require traders to complete validation and manage execution simultaneously — cognitive overload that produces late entries on exactly the setups that deserve the best entry. We separate validation workflow from execution workflow.
Validate with patience. Execute with speed. Trade bullish flags with structure →
Relative Reading
Explore the Momentum Pillar:
- Momentum Trading Guide - The foundational framework underlying all continuation pattern identification
- Bull Flag Pattern: Channel Entry Guide - Entry mechanics for validated bullish flags — channel-bottom formation entry vs breakout confirmation
- Why Most Traders See Engulfing Candles Too Late - Volume-first identification applied to single-candle reversal patterns
- Inverse Head & Shoulders: The Contrarian Entry Guide - Reversal pattern validation framework using comparable signal logic
- Trading Tools & Resources Hub - Pattern screeners, volume analysis tools, and bullish flag validation checklists
Cross-Pillar Connections:
- The Speed Advantage - Why validated setups still require sub-second infrastructure to execute at formation price
- Slippage Control: Architecture-First Approach - Clean execution on pre-configured orders when channel-bottom trigger fires
- Trading Psychology for High-Frequency Scalping - Discipline architecture for completing validation stages without impulse entry
- How to Reduce Execution Search Time by 80% - UI efficiency ensuring validation workflow doesn't cost you the entry window